Create Professional Graphs & Diagrams Instantly
Need polished graphs for your presentation? Generate professional diagrams, flowcharts, and charts using TeamDay.ai's Mermaid integration.
Why Use AI for Diagrams & Graphs?
Stop struggling with complex diagramming tools. Get professional-quality visuals by simply describing what you need.
Key Benefits:
- Time Efficiency: Create diagrams in seconds instead of hours.
- No Learning Curve: Describe what you need in plain language—no need to learn complex syntax.
- Professional Quality: Generate clean, presentation-ready visuals every time.
- Easy Modifications: Quickly iterate and refine your diagrams with simple instructions.
Meet the Graph Creator Agent
We've built a specialized agent dedicated to creating beautiful diagrams and charts. Our Graph Creator agent generates clean, semantic diagrams using Mermaid syntax for all your visualization needs.
Chat with our Graph Creator Agent to generate your own diagrams instantly!
Whether you're visualizing workflows, organizational hierarchies, database schemas, timelines, or simple data breakdowns, Graph Creator delivers clear, ready-to-use code for rendering professional-looking graphs.
The Right Diagram for Every Need
TeamDay.ai can generate a variety of diagrams to suit your specific requirements:
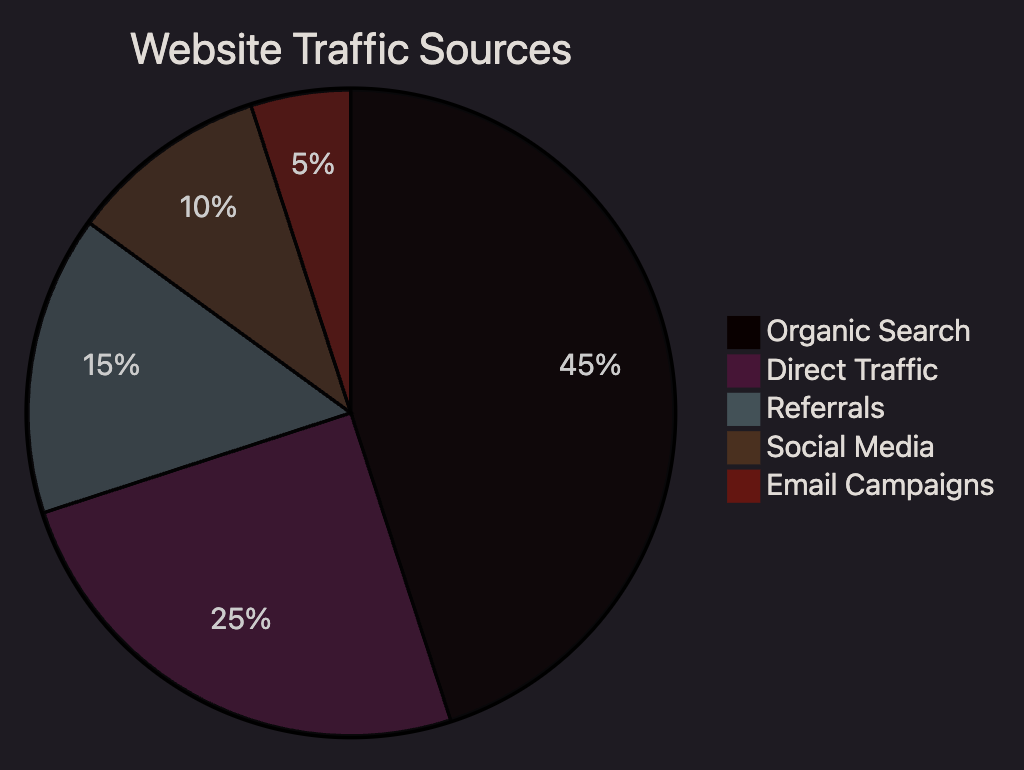
Pie Charts
Perfect for showing data distribution and proportions. Use when you need to visualize market share, budget allocation, or survey results.
Flowcharts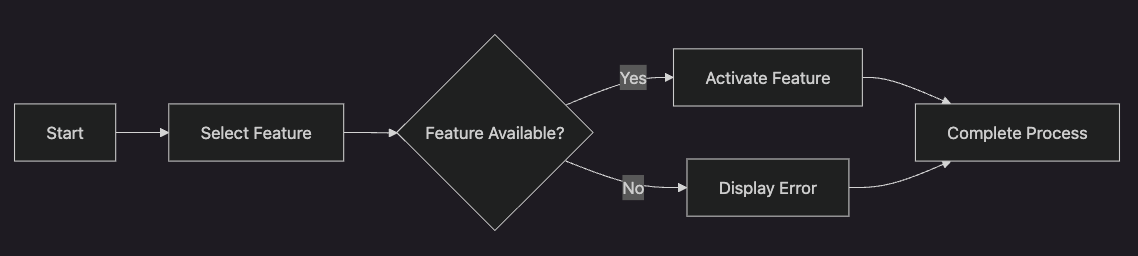 Ideal for visualizing processes, decision paths, and workflows. Use when explaining algorithms, customer journeys, or operation procedures.
Sequence Diagrams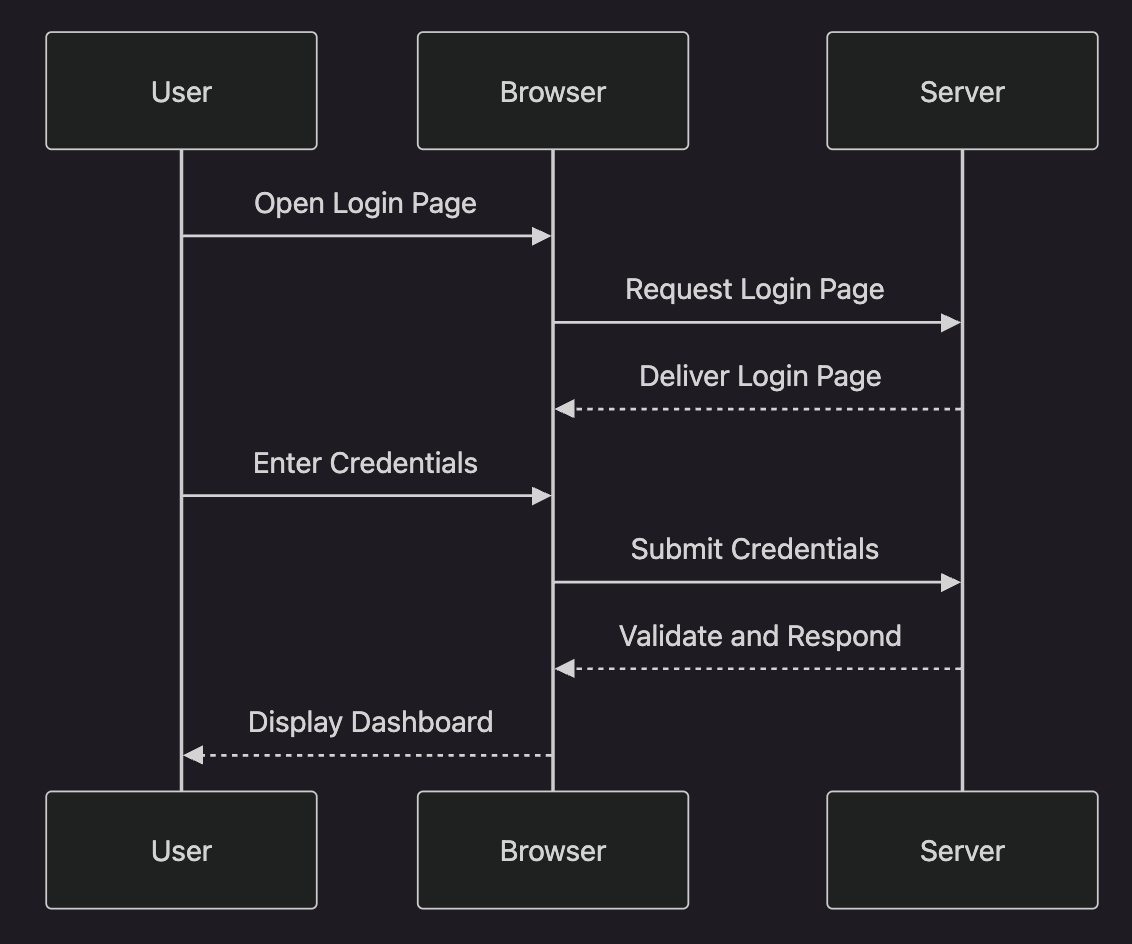 Best for showing interactions between systems over time. Use when describing API flows, user interactions, or communication protocols.
Class Diagrams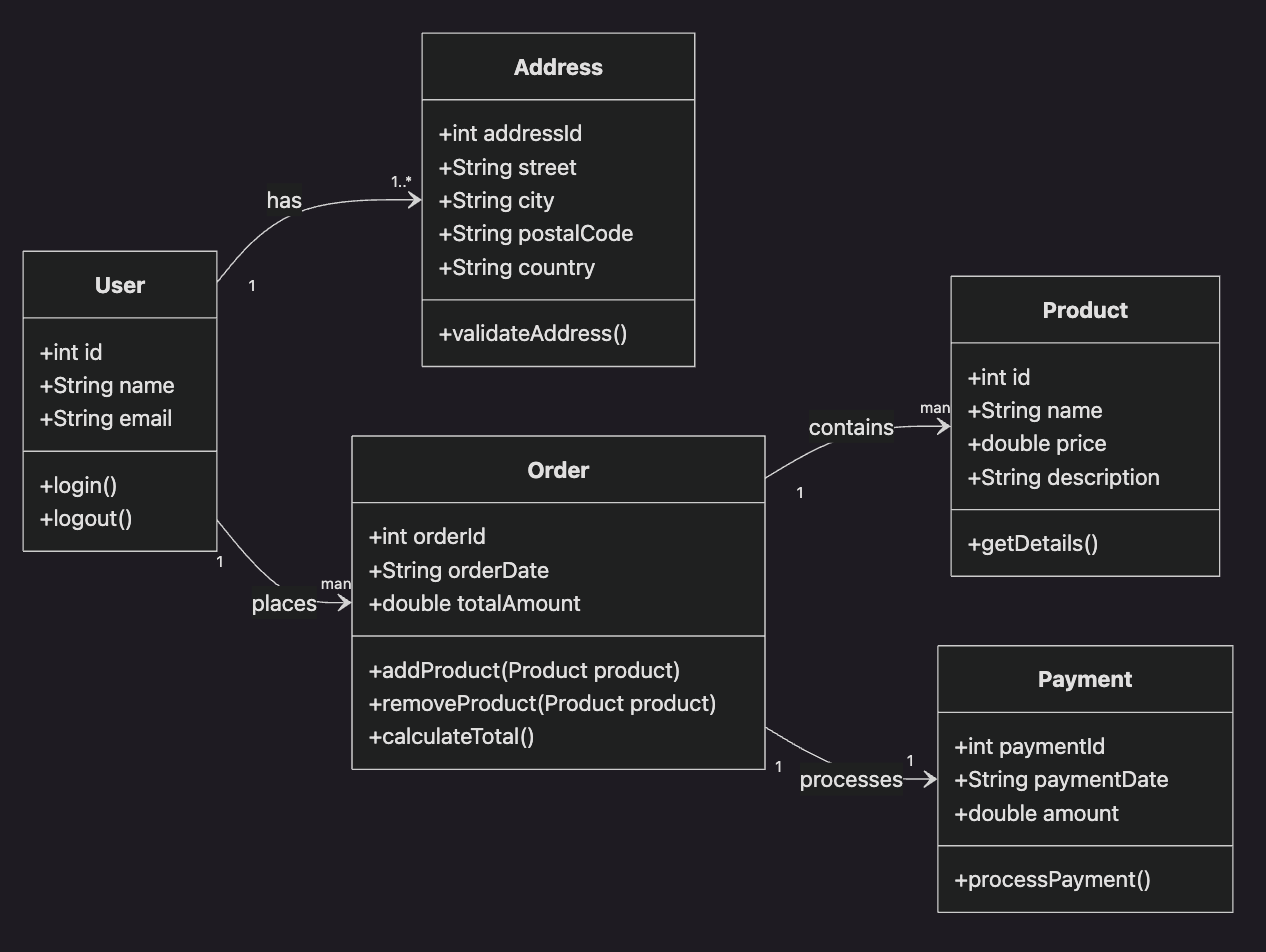 Essential for software architecture and design. Use when planning object-oriented programs, class relationships, or system structures.
ERD (Entity Relationship Diagrams)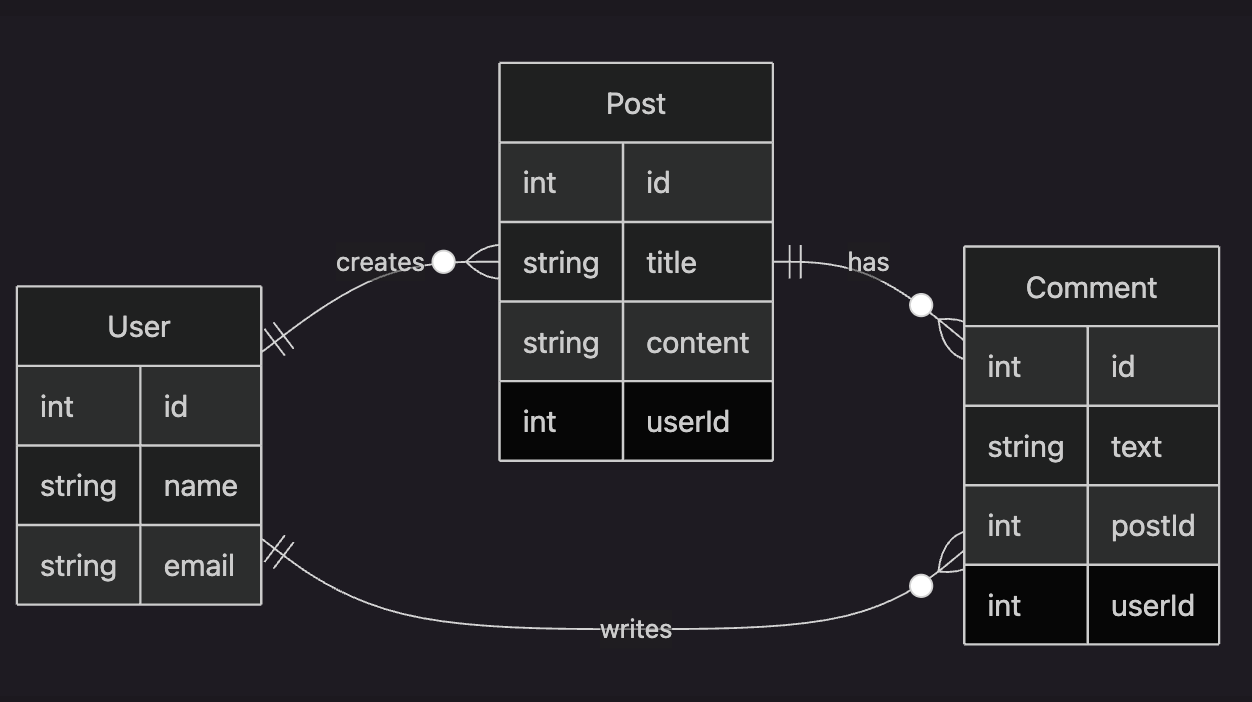 Crucial for database design. Use when planning database schemas, table relationships, or data models.
Gantt Charts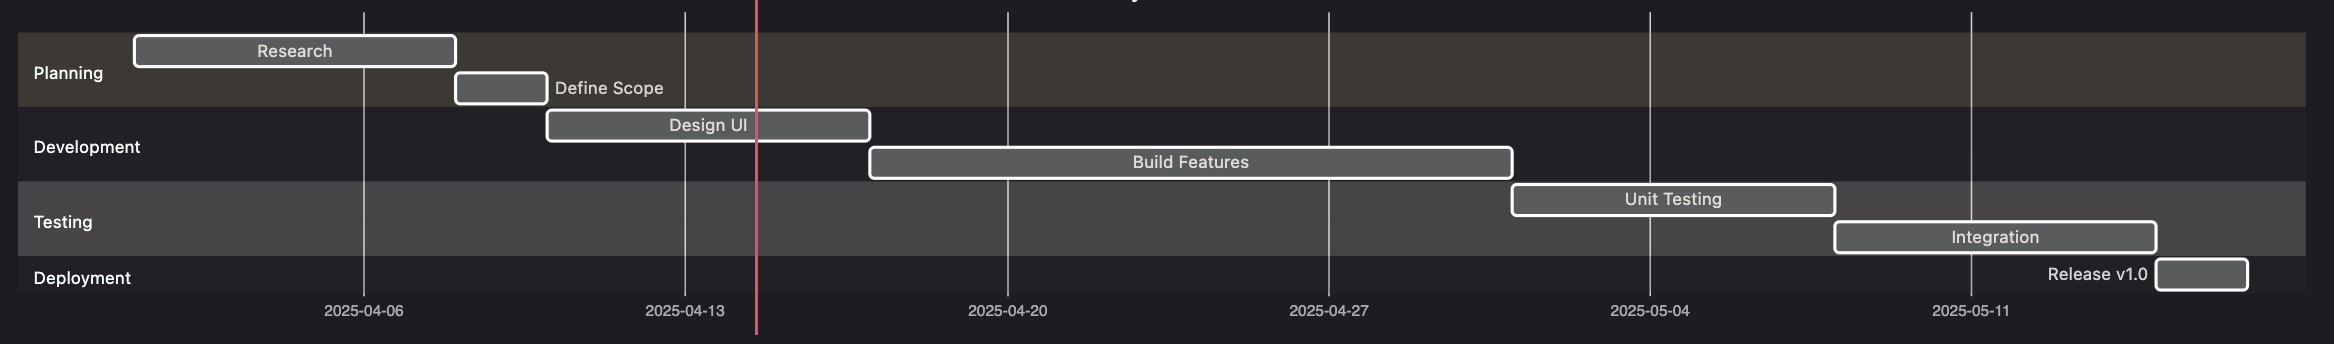 Perfect for project planning and scheduling. Use when visualizing timelines, task dependencies, or project milestones.
Real-World Impact
"I needed a complex system architecture diagram for a client presentation due in hours. TeamDay.ai created exactly what I needed in minutes instead of the hour it would have taken me. The client was impressed, and I saved valuable prep time." - Solutions Architect
Use Cases:
- Presentations: Create clear, impactful charts and diagrams for business decks.
- Documentation: Illustrate processes and systems for technical documentation.
- Planning: Map out project workflows and dependencies visually.
- Data Visualization: Transform numbers into intuitive pie charts, bar graphs, and more.
Example Agent: Use the Diagram Expert or Presentation Assistant agent to generate your visuals.
Getting Started: Simple Steps
- Describe Your Diagram: Tell the AI what type of diagram you need (flowchart, sequence diagram, pie chart, etc.) and explain the content.
- Generate: Let TeamDay.ai create the Mermaid code and render your diagram.
- Refine: Ask for adjustments if needed ("make the second box bigger," "change colors to blues").
- Export: Download your diagram as an image ready for use in presentations or documents.
Example:
Prompt Used:
"Create a pie chart showing market share distribution between the top 5 tech companies"
Result:
Pro Tips for Better Diagrams
- Be Specific: Include details like node names, relationships, and any color preferences.
- Start Simple: Begin with a basic structure, then refine with additional details.
- Use Business Context: Explain the purpose of your diagram for more relevant results.
Ready to Visualize Your Ideas?
Transform your concepts into professional diagrams without the hassle. Whether for business presentations, project planning, or technical documentation, create the perfect visual in seconds.
Remember: Great visuals make your ideas more understandable and memorable.